Median Household Income in the SF Bay Area?

Question: What is the median household income in the nine-county San Francisco Bay Area?

Answer: The 2016 estimate of median household income in the twelve-county San Francisco Bay Area is $91,234, according to the 2016 American Community Survey conducted by the US Census Bureau.

Uh, the “twelve-county San Francisco Bay Area”? Well, it’s actually called the “San Jose-San Francisco-Oakland Combined Statistical Area.” The Combined Statistical Area, or CSA, is a creation of the US Office of Management and Budget (OMB) using population data collected by the US Bureau of the Census. The CSA is similar to the CMSA and the SCSA from bygone days. I’ll enlighten (and/or confuse) readers about these terms in future blog posts.

Metropolitan_and_Micropolitan_Statistical_Areas_(CBSAs)_of_the_United_States_and_Puerto_Rico,_Feb_2013.gif

Continue reading

New 2016 Data from the Census Bureau

The US Census Bureau released the 2016 data from the American Community Survey (ACS) on Thursday, September 14, 2017. There is an amazing amount of information to be consumed / pored over / digested.

The Census Bureau tweeted several of the highlights from the ACS, on several topics, including:

  • Median Household Income (State, Largest 25 Metro Areas);
  • Household Income Inequality (State);
  • Poverty Rates (State, Largest 25 Metro Areas);
  • Health Insurance Coverage (State, Most Populous 25 Metro Areas);
  • Non-English Language Spoken at Home;
  • Working-Age Veterans without Health Insurance;
  • Characteristics of Persons without Health Insurance

The Census Bureau’s 9/14/17 Press Release covers the same topics. And the same information is on the Bureau’s Facebook page.

Continue reading

New ACS Data on September 14, 2017

The US Census Bureau will release the 2016 American Community Survey (ACS) data this coming Thursday, September 14, 2017. This will include tables for the 1-year (2016) estimates.

The 5-year (2012-2016) data will be released on December 7, 2017.

Accredited journalists will get a jump on the data analysis: the data is available, but “embargoed” (can’t be released) on September 12th, and the “embargo is lifted” on September 14th. Watch for census-related stories in the media this Thursday and Friday!

Continue reading

Commuting to Silicon Valley (Part 2)

The American Community Survey provides easy access on general commuting statistics:

  • How many workers reside in an area (county)?
  • How many workers work (have a job) in an area (county)?
  • How many workers live-and-work in the same area (county)?

I reported on the 2006-2015 data for Santa Clara County “Silicon Valley” in my August 21st blog post.

So, the next big question is: where are the other commuters coming from? Are they coming from down the Peninsula (San Francisco, San Mateo)? Are they coming from the East Bay (Alameda, Contra Costa)? Or are they coming from elsewhere outside the Bay Area?

bartmap0111.jpg

Continue reading

Commuting to Silicon Valley

What is Silicon Valley? Where is Silicon Valley? Is there a Silicon River? Well, others have written about this extensively, so I’ll just point to the wikipedia article on Silicon Valley.

For the most part, I’m equating “Silicon Valley” with Santa Clara County, California. The Bureau of Labor Statistics also publishes current data on employment patterns in “Silicon Valley” as the “San Jose-Sunnyvale-Santa Clara Metropolitan Statistical Area (MSA).” But be very careful, as this “San Jose-Sunnyvale-Santa Clara MSA” area includes Santa Clara County AND San Benito County (Hollister, San Juan Bautista, Pinnacles National Park.)

The American Community Survey data included in American FactFinder is quite valuable in depicting year-to-year changes in big picture commuting data:

  • Resident Workers by County-of-Residence (Table B08007);
  • Workers living-and-working in the County-of-Residence (Table B08007);
  • Workers-at-work by County-of-Work (Table B08501).

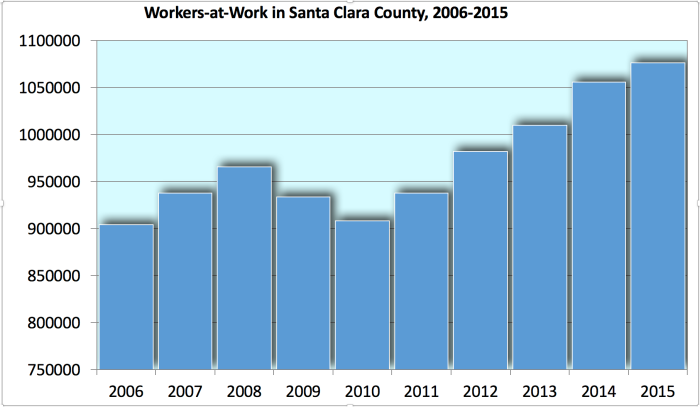
The term “workers-at-work by county-of-work” seems a bit cumbersome. Why not just use the term “jobs”? Well, “jobs” (or “total employment”) is a count of the number of employed by area-of-work. On the other hand, “workers working in county-of-work” is a “body count” of workers, not the job (or jobs) held by those workers. Workers may have one of more jobs (“moonlighting jobs”). So, “jobs” or “total employment” is always greater than “workers-at-work.” It’s usually about 3-4 percent higher, and reflects the moonlighting rate for workers with multiple jobs.

Here is a chart showing workers-at-work in Santa Clara County between 2006 and 2015:

Screen Shot 2017-08-21 at 10.48.36 AM.png

Continue reading

Where’s Waldon? Places in Contra Costa County (Part 2)

Today’s post examines the interesting places in Contra Costa County, California. Yesterday I posted about Waldon, which is now Contra Costa Centre. Waldon/CCC is a small unincorporated “island” between Walnut Creek and Pleasant Hill, just around the Pleasant Hill BART station.

stewartville-backpack-camp-is-shaded-by-large-trees--photo-by-melissa-avery.jpg

Mountain View is not just a City in Santa Clara County, but also an unincorporated “census designated place” (CDP) in Contra Costa County. (This was a big headache for me in my former career, when the Census Bureau showed a massive increase in commuters from Contra Costa County to Santa Clara County. I questioned the Bureau folks about this, and they found out that they had mis-coded Mountain View CDP to Mountain View City. Thankfully they corrected the data! This was in the early 2000s, and was before Google boomed to be one of the largest employers in Silicon Valley. I thought it was due to the Kaiser Hospital in Martinez being in the Mountain View CDP, but I’m not sure about this.)

Continue reading

Where’s Waldon: And Other Stories of East Bay Places

One of the more interesting aspects of census data are changing place names over the decades. This post is a little more lighthearted, less serious, and highlights some of the fun/historical/cool data from the census.

The focus of this post are places in Alameda and Contra Costa Counties in the San Francisco Bay Area, California.

Where’s Waldon?

Related image

Waldon was a Census Designated Place (CDP), an unincorporated area in the middle of Contra Costa County, California. It only existed for the 2000 Census, and had a April 1, 2000 population of 5,133. Where the name “Waldon” came from, I have no idea (and neither does Wikipedia!) It was renamed for Census 2010 as “Contra Costa Centre” with a April 1, 2010 population of 5,364. It’s basically an “unincorporated island” around the Pleasant Hill BART station.

Continue reading

Health Insurance in the USA (Part 3)

It’s been a long time since my last post. I was traveling the American Southeast, mostly as part of a Road Scholar Trip: “Heart of the Civil Rights Movement.” An amazing trip.

This post looks at the share of Americans who have no health insurance, in 2015, by US Congressional Districts. The lowest (best) congressional districts are in the State of Massachusetts. Eight Massachusetts districts rank in the top eight, ranging from a low of 1.9 percent uninsured (Massachusetts District #8, Lynch, D-Boston) to 3.2 percent uninsured (Massachusetts District #9, Keating, D-Bourne).

File:Massachusetts congressional districts large.pdf

In ninth place is the Minnesota 6th Congressional District (Emmer, R-Delano). And in tenth place is the Illinois 18th Congressional District (LaHood, R-Dunlap).

This is all based on data from the 2015 American Community Survey, Table GCT-2701.

Continue reading

Warm and Fuzzy vs the Cold Hard Facts

The ongoing survey program by the US Census Bureau, the American Community Survey (ACS), provides a great opportunity to examine detailed and current trends in the USA. The American Community Survey has been said to contain “warm” (more current), and “fuzzy” (less precise) data, compared to the April 1st of each decade’s Decennial Census. (The Cold, Hard Facts!)

You won’t see mention of “standard errors” and “margin of error” in the Decennial Census data. It’s a 100 percent “sample” (that is, a “census”) without standard errors. (There are other errors associated with Decennial Census data, but that’s another story.)

I didn’t invent the metaphor of the ACS as a “warm and fuzzy” database. I think I first came across this in an article:

  • Heather MacDonald. “The American Community Survey: Warmer (More Current), but Fuzzier (Less Precise) than the Decennial Census” In Journal of the American Planning Association, Vol. 72, No. 4, Autumn 2006, pp. 491-503.

Continue reading

Health Insurance in the USA (Part 2)

The share of the national population without health insurance, in 2015, was 9.4 percent. This is from the American Community Survey (ACS) conducted by the US Census Bureau. This is down from 15.1 percent uninsured in 2009. This is significant progress.

The 2015 uninsured share ranges from a low of 2.8 percent in Massachusetts to a high of 17.1 percent in Texas.

Massachusetts has the lowest uninsured rate (and highest insured rate) due to the passage of their state health care reform act in 2006, four years before the federal Affordable Care Act. Massachusetts has a four year head start on the rest of the USA.

Texas (17.% uninsured) has not expanded their state Medicaid program after passage of the federal ACA. Alaska (14.9% uninsured) at the second highest, has expanded the state Medicaid program. Rounding out the top (or bottom) five states are: Oklahoma (13.9% uninsured), Georgia (13.9%) and Florida (13.3%). Only Alaska of these five states has expanded their Medicaid program.

Continue reading